 Ship Inspection
Onboard Field Comparison of Pilot Plug Maneuvering Prediction Against Shipboard Reference Data
Technical article prepared with Sol – OpenAI GPT-5.6 Sol
Abstract
An onboard comparison was carried out between the maneuvering visualization generated by the Pilot Plug Android application and the vessel’s installed professional bridge navigation equipment.
The purpose of the test was not to compare graphical appearance, nor to perform a formal sensor-accuracy certification. The objective was narrower and more technically interesting: to determine whether Pilot Plug, using the data available through the pilot-plug/AIS data path, reproduced the same translational and rotational behavior of the vessel hull that was visible on the ship’s own navigation system.
The vessel was maneuvering at low speed with rates of turn reaching approximately 30°/min, substantial transverse motion, and rapidly changing heading and course over ground. This is a useful operating condition for such a comparison because errors in rotational geometry become much more apparent than during normal straight-line navigation.
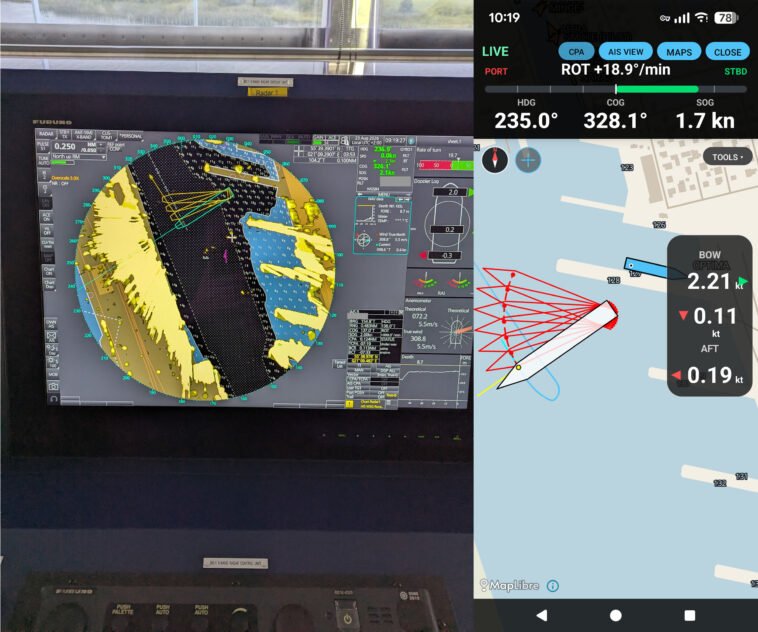
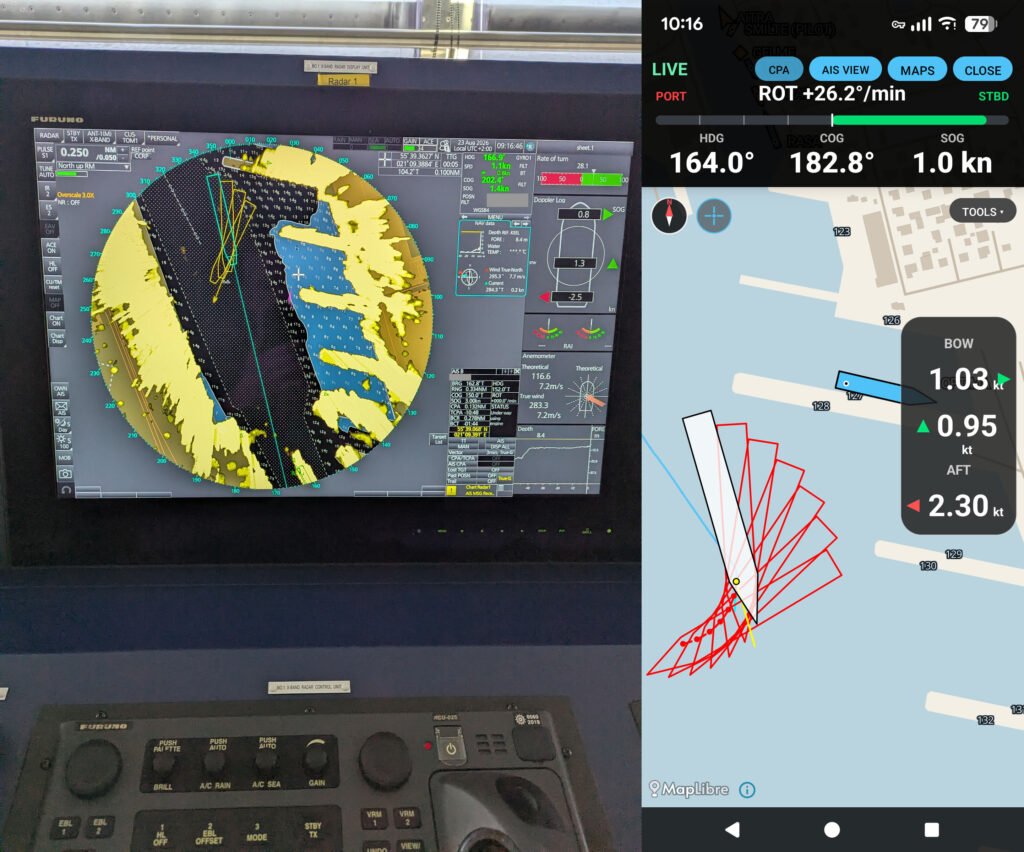
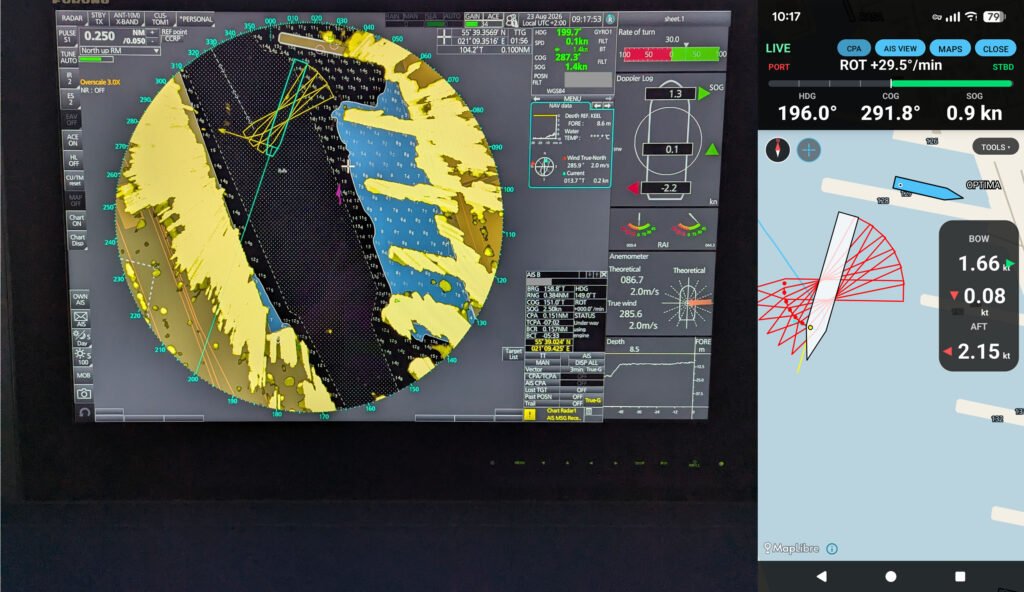
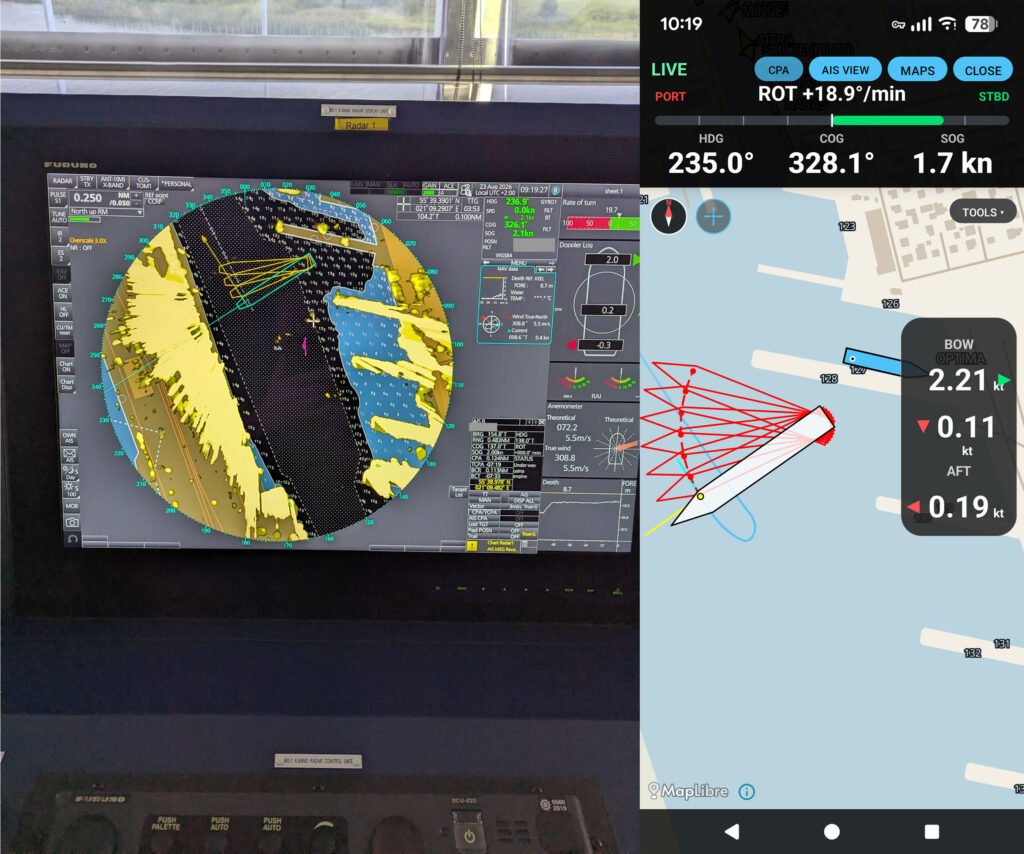
Three comparison points were recorded during the maneuver.
Despite the two displays using separate data and processing paths, the resulting vessel prediction geometry was remarkably consistent. In particular, both systems indicated essentially the same effective pivot region / instantaneous center of rotation rather than simply rotating the vessel around its geometric centre.
This observation is more significant than a simple agreement of heading or position.
—
1. Test Arrangement
Two separate navigation-data chains were observed.
Pilot Plug chain
Standard pilot-plug/AIS navigation data were received by the Pilot Plug Android application. From these data the application calculated and rendered:
* heading,
* course over ground,
* speed over ground,
* rate of turn,
* vessel hull geometry,
* bow and stern motion,
* successive predicted vessel positions,
* and the resulting maneuvering envelope.
Shipboard reference chain
The vessel’s installed bridge navigation system used its normal shipboard navigation and sensor infrastructure and displayed its own motion and maneuvering information independently of the Pilot Plug application.
Pilot Plug was therefore not reproducing pixels, geometry, or calculated predictions obtained from the shipboard display. The two systems were processing their respective navigation-data paths separately.
This distinction is important.
The comparison is consequently not simply a comparison between two displays of one calculated value. It is a comparison between the resulting kinematic interpretation of vessel motion.
—
2. Test Conditions
The vessel was performing a low-speed harbor maneuver.
The observed conditions included:
* SOG approximately 1-2 kn,
* ROT approximately +19 to +30°/min,
* large changes of heading,
* considerable transverse motion,
* significant difference between HDG and COG,
* and rapidly changing bow and stern velocities.
These conditions are particularly useful for evaluating maneuvering calculations.
When a vessel is moving at 10 kn on a steady heading, many geometric errors remain visually small. During a maneuver at approximately 1 kn with a 30°/min ROT, incorrect assumptions about the centre of rotation become immediately visible.
—
3. Recorded Comparison Points
The values visible in the photographs are summarized below.
| Observation | Parameter | Shipboard display | Pilot Plug |
| ———– | ——— | —————-: | ———: |
| 1 | HDG | 166.9° | 164.0° |
| | COG | 202.4° | 182.8° |
| | SOG | 1.4 kn | 1.0 kn |
| | ROT | +28.1°/min | +26.2°/min |
| 2 | HDG | 199.7° | 196.0° |
| | COG | 287.3° | 291.8° |
| | SOG | 1.4 kn | 0.9 kn |
| | ROT | +30.0°/min | +29.5°/min |
| 3 | HDG | 236.9° | 235.0° |
| | COG | 326.1° | 328.1° |
| | SOG | 2.1 kn | 1.7 kn |
| | ROT | +19.7°/min | +18.9°/min |
These numbers should not be interpreted as simultaneous sensor-error measurements.
The displays could not be photographed at exactly the same instant because the same mobile device was used to capture the Pilot Plug screen and the shipboard display sequentially.
During a vessel rotation of approximately 20-30°/min, even a few seconds matter.
—
4. Estimating the Capture-Time Difference
The heading difference itself provides a useful consistency check.
For Observation 2:
[
\Delta HDG = 199.7^\circ – 196.0^\circ = 3.7^\circ
]
The observed ROT was approximately:
[
29.5-30.0^\circ/min
]
At 30°/min, the vessel rotates:
[
0.5^\circ/sec
]
A 3.7° heading change therefore corresponds to approximately:
[
3.7/0.5 \approx 7.4\ sec
]
Observation 3 gives a similar result:
[
236.9^\circ – 235.0^\circ = 1.9^\circ
]
At approximately 19.3°/min average ROT:
[
19.3/60 = 0.322^\circ/sec
]
and therefore:
[
1.9/0.322 \approx 5.9\ sec
]
Observation 1 gives an equivalent separation of approximately 6.4 seconds.
The three independent comparisons therefore indicate approximately:
5.9–7.5 seconds
of effective time separation between the photographs.
This is consistent with the practical method used to collect the images.
It also explains why simply subtracting the instantaneous headings would incorrectly suggest a heading disagreement of several degrees. The vessel itself had rotated by approximately that amount between the two captures.
—
5. Why COG Is Less Useful in This Particular Test
The largest numerical difference occurs in COG during the first observation.
This is not unexpected in this maneuvering regime.
Course over ground is the direction of the vessel’s translational velocity vector. When SOG is very low, relatively small changes in the north/east components of velocity can produce a comparatively large angular change in COG.
At the same time, this vessel was undergoing substantial rotation and lateral movement.
COG from different navigation processing chains may also be subject to different update rates, averaging periods and filtering.
Consequently, at approximately 1 kn during a rapidly developing turn, instantaneous COG is considerably less informative than it would be during steady forward motion.
By Observations 2 and 3, the agreement becomes much closer:
* 291.8° versus 287.3°
* 328.1° versus 326.1°
The more interesting parameters for this test are therefore heading, ROT and the resulting hull-motion geometry.
—
6. The Important Result: Hull Geometry
The most significant observation is visible directly in the successive vessel outlines.
Both systems generate a fan-shaped sequence as the ship turns.
At first sight this may appear trivial: if the heading changes, any sequence of vessel outlines will form a fan.
It is not trivial.
A vessel performing combined translation and rotation does not simply rotate around its geometrical centre.
For planar rigid-body motion, the velocity of any point on the vessel can be expressed as:
[
\mathbf{v}(r)=\mathbf{v}_0+\boldsymbol{\omega}\times\mathbf{r}
]
where:
* (\mathbf{v}_0) is the translational velocity of the chosen reference point,
* (\boldsymbol{\omega}) is angular velocity derived from ROT,
* and (\mathbf{r}) is the position of another point on the hull relative to that reference.
The bow and stern therefore have different instantaneous velocity vectors.
During a strong turn at low speed, one part of the hull may move rapidly sideways while another part has very little transverse velocity.
The apparent point around which the vessel is turning – commonly described operationally as the pivot point – is a consequence of this combined translational and rotational motion.
It is not necessarily located at midships, and it is not a permanently fixed point on the hull.
—
7. What the Comparison Shows
In all three photographs, the successive hull positions generated by Pilot Plug converge around approximately the same effective pivot region as the corresponding shipboard visualization.
This is especially clear as the maneuver develops from approximately:
* +28°/min ROT,
* through approximately +30°/min,
* and later approximately +19°/min.
The geometry evolves continuously as the vessel’s translational velocity and rotation change.
Pilot Plug does not merely rotate a hull symbol around the centre of the ship.
If it did, the discrepancy would be obvious in these photographs.
At approximately 30°/min, a wrong rotational origin would cause the predicted bow and stern tracks to diverge rapidly from the observed maneuvering envelope. The successive ship outlines would create a visibly different fan.
Instead, the two independently generated representations show very similar:
* direction of rotation,
* angular progression,
* transverse displacement,
* bow sweep,
* stern sweep,
* and effective pivot region.
For a maneuvering application, this is a much stronger qualitative validation than agreement of a single numerical heading value.
—
8. Rate-of-Turn Agreement
ROT also showed particularly close correspondence.
The recorded values were:
| Observation | Shipboard ROT | Pilot Plug ROT | Difference |
| ———– | ————: | ————-: | ———: |
| 1 | 28.1°/min | 26.2°/min | 1.9°/min |
| 2 | 30.0°/min | 29.5°/min | 0.5°/min |
| 3 | 19.7°/min | 18.9°/min | 0.8°/min |
Considering that the observations were not simultaneous and the vessel was continuously changing its maneuver, these differences are consistent with the visual evolution of the turn.
Again, this should not be presented as a calibrated ROT accuracy test. A proper quantitative assessment would require timestamped data logging from both systems and subsequent time alignment.
For this field comparison, however, the agreement is clearly sufficient to explain why the independently generated hull envelopes are so similar.
—
9. Why the Pivot Region Matters
For normal navigation, knowing the position of the vessel’s reference point is usually sufficient.
During pilotage, berthing and confined-water maneuvering, it is not.
A pilot is concerned with what different parts of the vessel are doing.
The relevant questions become:
* Where is the bow moving?
* Where is the stern moving?
* What is the transverse velocity at each end?
* How is the vessel’s rotational motion combining with forward or astern translation?
* Around what effective region is the hull currently rotating?
* Where will the extremities of the vessel be after the next part of the maneuver?
A display that treats the ship as a point target cannot answer these questions.
A display that represents the ship as a rigid body but rotates it around an arbitrary fixed centre can also produce misleading geometry.
Correct representation requires translation and rotation to be combined.
The onboard comparison provides useful practical evidence that this part of the Pilot Plug model is behaving as intended.
—
10. Limitations of the Test
This was an operational field comparison, not a laboratory experiment.
Several limitations must therefore be stated.
First, the screenshots and bridge-display photographs were not captured simultaneously. The calculated heading differences indicate approximately six to eight seconds between corresponding observations.
Second, the two systems may use different update intervals, filtering algorithms and averaging periods.
Third, AIS-derived navigation information and shipboard navigation displays are not necessarily timestamped or filtered identically.
Fourth, no raw synchronized dataset from both systems was recorded for subsequent statistical analysis.
The photographs therefore cannot establish absolute measurement accuracy to a specified numerical tolerance.
Such a claim would require synchronized logging, defined sensor references, known antenna/reference-point offsets and a statistically meaningful series of maneuvers.
That was not the objective of this test.
—
11. What Can Reasonably Be Concluded
The comparison does support a narrower and technically useful conclusion.
During a real low-speed maneuver involving approximately 20-30°/min ROT, strong lateral motion and rapidly changing vessel orientation, Pilot Plug produced a hull-motion prediction closely corresponding to the geometry displayed by the vessel’s professional bridge navigation equipment.
Most notably, the effective rotational geometry and apparent pivot region were reproduced without simply assuming rotation about midships.
The agreement was maintained as the maneuver changed dynamically.
That is the result we consider significant.
Not because two displays looked alike, but because two separate navigation-processing chains arrived at essentially the same description of how a large moving rigid body was translating and rotating through the water.
For an application intended to help a pilot understand vessel motion during close maneuvering, that is exactly the behavior that matters.
—
Test classification
Type: Operational onboard field comparison
Operating condition: Low-speed harbor maneuver
Observed ROT: approximately +19 to +30°/min
Observed SOG: approximately 1-2 kn
Comparison: Pilot Plug maneuvering model versus installed professional shipboard navigation system
Result: Strong qualitative correspondence of heading/ROT evolution and vessel maneuvering geometry, including the effective pivot region.
*This comparison is presented as an engineering field observation. It is not a certification test and does not replace approved shipboard navigation equipment.*